The State of MCP observability: Observable.tools — Alex Volkov and Benjamin Eckel, W&B and Dylibso
Transcript
Alex Volkov: Hey, folks. My name is Alex Volkov. I'm an AI evangelist with Weights and Biases. Benjamin Echol: I'm Benjamin Echol. I'm co-founder and CTO of Dialypso. We're creators of mcp.run. Benjamin Echol: All right. And we're here to talk to you about mcp observability. Hey, Ben. I want to ask you a question.
Benjamin Echol: Yeah, sure. Benjamin Echol: Somebody who worked at Datadog before and somebody who runs multiple mcp servers and clients on production, something that happened, advice that happened, something in my agent in production the other day. Benjamin Echol: Okay. Yeah. I mean, we've been running mcp clients and servers in production since the beginning.
Benjamin Echol: Yeah, but wait. Aren't you like working at an observability company, Weights and Biases? Benjamin Echol: And don't you work on, like, what's it called? Weave? Benjamin Echol: Yep. That's true. I work on Weave. But since I started adding some powers to my agent via mcp, all that observability that I'm used to from just having my own code run end to end has gone a little bit dark.
Benjamin Echol: Gotcha. Benjamin Echol: So this is what we're here to talk to you guys about. The rise of mcp is creating an observability blind spot. Benjamin Echol: As AI agents become more prevalent, the problem can compound with more and more tools via mcps, the less the developers can know about the end-to-end happenings within their agent.
Benjamin Echol: Yeah. Yeah. So on mcp run, we're running both clients and servers. Benjamin Echol: And because it's a new ecosystem, we've had to, like, cobble together a lot of our own ways to do observability. Benjamin Echol: And I've been looking around, and it seems like everyone is sort of doing this in isolation, as we're solving the same problems.
So, you know, we wanted to bring the community together on this issue, and so today we're going to talk about the state of observability in the mcp ecosystem. Benjamin Echol: Yep. So why do we care about this, and why do we think that you guys should care about this?
Benjamin Echol: So if you don't have the ability to quickly understand why things went wrong on production, where they went wrong, and how, your ability to quickly respond is greatly diminished. Benjamin Echol: And we care deeply about -- we both build tools that need mcp observability, and we support mcp, and we both care deeply about developer experience as well.
Benjamin Echol: Yeah. It's really important to me because enterprise engineering teams don't ship something to production unless they know for sure that they're going to be able to identify security and reliability problems before their customers do. Benjamin Echol: And that's why they invest a ton of money in observability platforms.
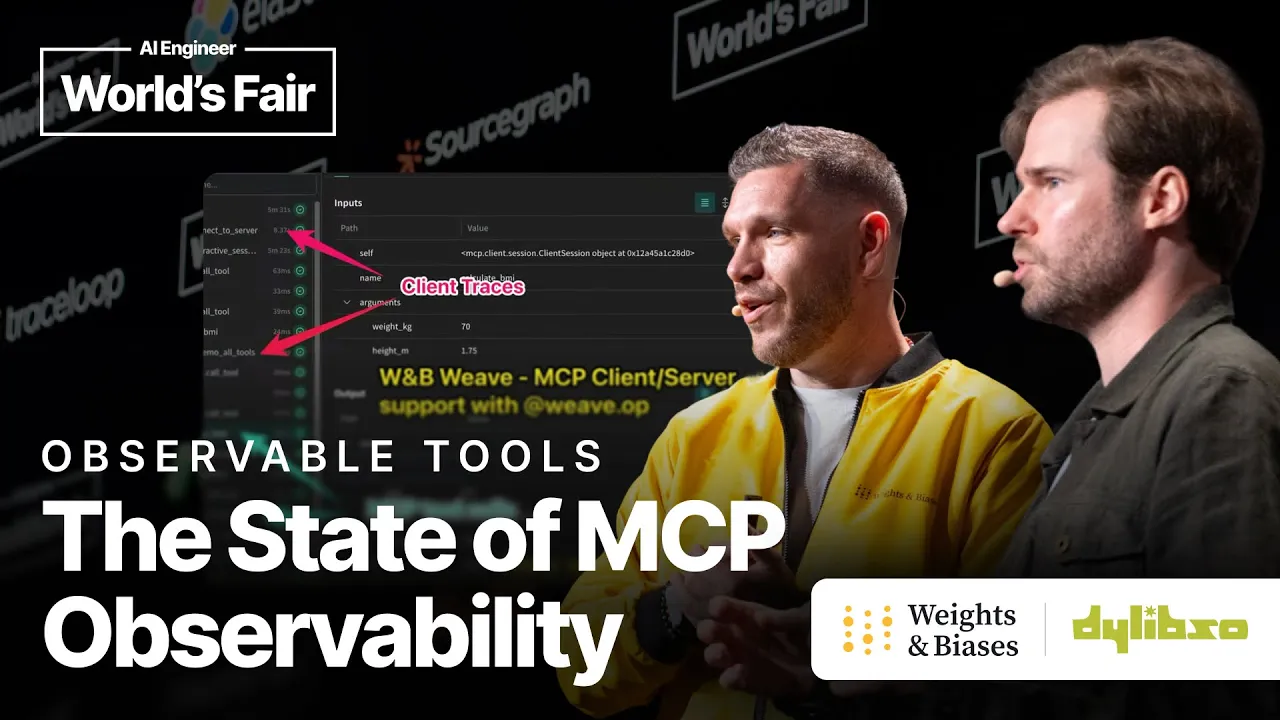
Benjamin Echol: And so if you're going to ship mcp to these production environments, you must seamlessly integrate with these observability platforms. Benjamin Echol: Yep. So because we care deeply about developer experience at WNB Weave, Benjamin Echol: I'm happy to announce here on stage that Weave supports MCP. Yay! Benjamin Echol: As long as you're a developer of both the client and the server, Benjamin Echol: all you need to do is set this MCP trace list operation environment variable Benjamin Echol: on your client and server, and we'll show you the list tool calls, Benjamin Echol: and we'll show you the duration of your MCP calls.
Benjamin Echol: This works currently with our Python-based clients, and this is how it looks. Benjamin Echol: Super quick. With the red arrows, you can see the client traces, for example, Benjamin Echol: and with the blue arrows, you can see we're pointing to the Calculate BMI tool Benjamin Echol: and the other tool, and that's it.
Observability solved, right? Benjamin Echol: Yeah. Benjamin Echol: Let's get off the stage. We're done. Benjamin Echol: No, wait a second. Benjamin Echol: So what about this Calculate BMI tool, this MCP server? Why can't I see into that? Benjamin Echol: Yeah, we're working on this. Benjamin Echol: Yeah, also this seems like this is specific to Weave, right?
Benjamin Echol: Is there not like a vendor-neutral way to do this and standardize? Benjamin Echol: Yeah, that's right. Benjamin Echol: This is a bespoke integration that we built into Weave into our SDKs in Python, Benjamin Echol: and while working on this, while our developers have been building this, like, Benjamin Echol: integration within our MCP tooling, I was advocating internally and externally Benjamin Echol: that we should align with the open nature of MCP as a concept Benjamin Echol: and created observable.tools.
Maybe some of you have seen this. Benjamin Echol: This is a manifesto to drive a conversation that this is a problem that needs solving. Benjamin Echol: And between observability providers such as us and other folks that's been on stage before Benjamin Echol: and going to be on the evil track tomorrow, to do observability in a vendor-neutral Benjamin Echol: and standardized way.
Benjamin Echol: And so while working on observable tools, I realized-- I did some search-- realized Benjamin Echol: that a vendor-neutral, scalable way to add observability exists. Benjamin Echol: And there could be a great way to marry the two open protocols to work together. Benjamin Echol: Yeah, exactly. Benjamin Echol: Fortunately, MCP-powered agents are really just another distributed system, and we've been doing that for decades.
Benjamin Echol: So open telemetry is just the way that we've settled on doing that. Benjamin Echol: We're going to talk about OTEL a little bit. Benjamin Echol: If you're not familiar with it, we need to learn about a few primitives first. Benjamin Echol: So the main primitive that we need to learn about is the trace.
Benjamin Echol: So a trace is kind of like an atomic operation in your system. Benjamin Echol: It's made up of a tree-like structure of steps that we call spans. Benjamin Echol: And a span represents the duration and some arbitrary metadata for each step. Benjamin Echol: And what this step is exactly is completely up to you to define.
Benjamin Echol: It can be as high-level as like an HTTP request. Benjamin Echol: It can be as low-level as a tiny little function call. Benjamin Echol: Here's an example of like a checkout experience, an API for a checkout. Benjamin Echol: The size and position of each of these spans correspond to how long it took Benjamin Echol: and where it sits in the call graph, respectively.
Benjamin Echol: And just from this data, you can tell a lot about a system and how to observe it. Benjamin Echol: The other primitive you need to be aware of is syncs. Benjamin Echol: So a sync is kind of like a centralized database where all your telemetry goes. Benjamin Echol: But often they come in the form of this whole platform with like a UI and dashboards Benjamin Echol: and alerting and monitoring and all those things.
Benjamin Echol: So there's a lot of logos here, Ben. Benjamin Echol: Yeah. Benjamin Echol: Basically a sync is an open standard way for folks like collectors to receive those spans. Benjamin Echol: As long as the developer instrumented their application code in a certain standard Benjamin Echol: spec way, everybody can just receive those in the same unified way, right?
Benjamin Echol: Exactly. Benjamin Echol: Yeah. Benjamin Echol: If you squint, it's just kind of like a bunch of databases that all support Benjamin Echol: the same schema and wired protocol. Benjamin Echol: And in fact-- Benjamin Echol: You can switch them out. Benjamin Echol: And in fact, they don't have to change much of their code or even change the code Benjamin Echol: No.
Benjamin Echol: It could be just config, right? Benjamin Echol: Right. Benjamin Echol: By the way, LM observability tools like WNBweave and some friends, Benjamin Echol: Simon from here before and some other friends, all have switched to support O-Tel as well, OpenTelemetry, is becoming like this global standard. Benjamin Echol: Great.
Benjamin Echol: Yeah, another great thing about having a centralized sync is the last concept, distributed tracing. Benjamin Echol: So going back to our checkout endpoint, if the fraud service sends its span to the same sync, then we can stitch back together the traces and show the whole context. Benjamin Echol: So maybe you're kind of seeing where the MCP server stuff comes in here.
Benjamin Echol: Yeah. Benjamin Echol: So, hey Ben, if it's possible via the integration to the open protocol, what if I want to use MCP servers that other people host, like GitHub, like Stripe, like other folks? Benjamin Echol: Yeah, that's a good question. Benjamin Echol: So with MCP-enabled agents, or really just any distributed system, there are kind of two scenarios.
There's when the client and server are in different domains, and then there's when they're in the same domain. And by domain here, I don't necessarily mean the literal definition. Benjamin Echol: I just mean like the administrative domain of control, right? Benjamin Echol: Like do you own this MCP server?
Benjamin Echol: Do you own this MCP client? Benjamin Echol: Or is it a third party thing? Benjamin Echol: So your GitHub Stripe example is like a great example of like the different domain scenario. Benjamin Echol: So this is a trace of an agent that is executing the prompt, read and summarize the top article on Hacker News.
Benjamin Echol: So it's going to reach out to this like remote fetch server to read Hacker News. Benjamin Echol: But it appears to us that the trace is a single service span because it runs outside of our domain of control. Benjamin Echol: So it appears to a black box to us.
Benjamin Echol: But suppose we do own the server. Benjamin Echol: Like maybe it's running in a different data center than the client. Benjamin Echol: How do we get actually the whole context? Benjamin Echol: It's pretty simple. Benjamin Echol: So with distributed tracing and context propagation, we can have the remote fetch server, send its spans to the same sync as the client.
Benjamin Echol: And the sync will just stitch together the missing parts of the trace back for us. Benjamin Echol: So in this graphic, you can see that we can now break into that fetch server. Benjamin Echol: And we can see what it's doing. Benjamin Echol: It's making some HTTP request that's taking roughly 350 milliseconds and then it's doing a little crunching to create some markdown.
Benjamin Echol: Okay. Benjamin Echol: Okay. Benjamin Echol: So that's great in theory. Benjamin Echol: And we ran through this. Benjamin Echol: We can have a whole hour talking about OTEL. Benjamin Echol: Not that we've got an hour. Benjamin Echol: But how do we can actually marry those two protocols together, right?
Benjamin Echol: Is there a standard way? Benjamin Echol: Did the MCP spec folk deploy a way for us for observability? Benjamin Echol: Not quite. Benjamin Echol: It was pretty tricky to get working. Benjamin Echol: It does work today, but it required a little bit more work than it should have.
Benjamin Echol: So in order to do this, we need to, as I said, propagate the trace context from Benjamin Echol: From the client to the server. Benjamin Echol: So here's a TypeScript example. Benjamin Echol: And when we call a tool in the client, we're going to extract our current span.
Benjamin Echol: And we're going to pass it along to the server. Benjamin Echol: And we achieve this by basically just shuttling the data through the protocol's meta payload. Benjamin Echol: And now that we're inside the server, this would be like in the fetch server, Benjamin Echol: We can pull that trace context out, inherit it as our current span.
Benjamin Echol: And then when we send our spans off to the sink, it's as if it came from that parent span. Benjamin Echol: And the sink can stitch it back together. Benjamin Echol: And this is awesome. Benjamin Echol: So you basically used an undocumented kind of property of sending the payload together with the payload between clients and servers to pass along the data that OTL needs to connect those things together, right?
Benjamin Echol: Yeah, sort of. Benjamin Echol: I just kind of had to abuse the lower-level interface reserved for the protocol. But higher-level ways should be provided through tooling, and that's something we should talk about a little bit later in the talk. Benjamin Echol: Yeah. Benjamin Echol: Oh yeah. Benjamin Echol: So by the way, this is not just a screenshot.
This is a working demo, so it's a lot more code than what I showed in the slide. Benjamin Echol: So if you want to actually go see how this works and adapt this for your needs, go check out this GitHub link. And I think actually you did that to get it to work with Weave, right?
Benjamin Echol: Yeah. So now that we know how to pass context after you showed me the way, let's see how amazing this solution actually is in practice. While Weave MCP, the thing I showed you guys before, was a bespoke solution baked into our Python SDK for Weave, the huge benefit of MCP, generally not only observability-related, is that servers and clients don't have to run on the same environment or share the same code or be from the same programming language.
So while we were working on the Python SDK, you built an agent in TypeScript. And so because WNB Weave supports OTEL, open telemetry, and it's an open protocol, your TypeScript agent, it took me a few minutes without changing much code to just send those traces into Weave Weave from a TypeScript agent and not necessarily from a Python agent.
So here you can see in the green, the client traces are in the green, and then the server traces actually show what happens within those calls on kind of the server side as well. Yeah, it's really cool. So how did you actually get the traces into Weave? So this is very, very simple.
Way simpler than before. We just defined WNB Weave as the OTLP endpoint, a standard that you kind of showed me around. And then folks can send their traces into 1b.ai/otel. And all you need to do in addition to this is authorize. So add authorization headers, and specify which project you want to go into.
Cool. Yep. So while we talked to you about the userability, while I was working on this, I had a magic moment happening with MCP. I wanted to share this with everybody. Yeah, okay. I love that MCP story. Yeah. So I used Cloud Opus 4 that just came out to Weaveify your agent that you built and to add this MCP userability, and WNB Weave is going to get a little meta, stay with us, also has an MCP server.
Okay. What does it do? So we have an MCP server that lets your agents or chats, et cetera, talk to your traces and see the data and summarize the data for you. Okay. So we have this MCP. It's been configured in my Winsurf, and Cloud Opus 4 was able to use this MCP server to kind of work through it.
So here you see an example. The agent basically started working on your code, and then decided, okay, I'm going to run the code, and then said, okay, I'm going to go and actually see if the traces showed up at WNB Weave. Then it noticed that they showed up, but they showed up incorrectly.
So some input or output, a specific parameter that it needed to do, it didn't know how to do. the documentation. And so the next moment just absolutely blew my mind. This Opus 4 discovered that our MCP server exposes a support bot. So essentially, another agent decided to write a query for it, received the right information after a while, and acted upon this information, learned how to fix the thing that it needed to fix fixed it, and then went back to notice whether or not the fix was correct.
So my coding agent talked to another agent via support via MCP that it discovered on its own. I didn't even know that this ability exists to work on your coding agent in things. The things got a little bit meta, and my head was like absurd. I was sitting like this while all this happened.
Didn't touch the keyboard once. That's awesome. Yeah. It's pretty meta. Yeah. Before we go, I also wanted to take a moment to have an announcement. So MCP run will also be exporting telemetry to OTEL-compatible syncs. So as I mentioned before, we run both servers and clients. So for servers, we have this concept called profiles.
And these allow you to slice and dice multiple MCP servers into one single virtual server. And we also have an MCP client called task. And this is like a single prompt agent that could be triggered via a URL or a schedule. And it also just sort of marries with the idea of profiles.
But yeah, soon you'll be able to get OTEL out of both of these. And hopefully, you know, we'll connect up to weights and biases and have a little party. Yeah. You can send those to we've traded from mcp.run. Okay. So to recap, observability is here in MCP today, but it's not evenly distributed.
It's not evenly distributed. OTEL should get you most of the way there. But the community needs to come together creating tooling and conventions to make it smoother. You should need to be an expert in observability to get this stuff working. So how do you get involved? Well, AI engineers just start thinking about observability via MCP tooling and whether or not you're getting observability to the end-to-end of your execution chain.
For tool builders and platform providers, we should join and work on higher-level SDKs. So Arise's open inference, for example, is a great start. But all of us should help with the instrumentation for our clients who use bespoke SDKs to work on conventions also together. Ben, can you explain semantic conventions super quick?
Yeah, sure. So as we learned earlier, spans, they carry user-defined attributes, right? So if they're user-defined, how does the sync know that a span is actually, say, an HTTP request with a 200 status code? Or how does it know that it's an MCP tool call that has an error?
That's where semantic conventions come in. And you can be a part of defining what the conventions are for agents that all observability platforms agree on. And if you're interested in this, I would suggest going to check out the Gen.AI semantic conventions effort by the OTEL team. And yeah, lastly, for platform builders such as MCP Run, you know, go add OTEL support, help review RFCs, and finally, yeah, just come like talk to us about ideas because we're just, everything's just kind of coming together.
Everything's so new and fresh and we don't really know exactly what to do. There's an additional track here at AI Engineer. This is called the hallway track. And I've learned more about the stuff that we were talking about out there by actually talking to people who implement this than I learned while preparing before the talk.
It's quite incredible. So, Ben? Yeah, sure. Yeah, so again, I'm Ben. And my call to action here would just be go check out MCP Run. You can get a free account. Try it out. Yeah, that's it. And I'm Alex. Check out WMB Weave MCP OP to learn how to trace MCP with OTEL.
I'm also, I did the observable tools initiative. I would love for you to check out the manifesto to see if this resonates with you, to join forces to talk about observability. And, yeah, please visit us at the booth. We have some very interesting surprises for you. We have a robotic dog right here that's observable.
I also run the Thursday AI podcast. I want to send Swix a huge, huge shout out for giving me the support to show up here. And if you guys are interested in AI news, we're going to record an episode tomorrow. That's it. Thank you so much. We'll see you next time.
Bye. We'll see you next time.