Intro to Machine Learning: Lesson 6
Chapters
0:0 Intro1:50 Horizontal Applications
3:10 Data Products
3:48 Objectives
4:52 Levers
5:40 What can levers do
7:2 What data does the organization have
8:45 A model
11:23 Counterfactual
12:16 Predictive vs Optimization
13:14 How do they all work together
14:33 Churn
18:17 Lead Prioritization
20:32 Define the Problem
23:50 Readmission Risk
25:30 Interpretation
31:1 Application
Transcript
So we've looked at a lot of different random and random forest interpretation techniques and a question that's come up a little bit on the forums is like what are these for really? Like how do these help me get a better score on Kaggle? And my answer has kind of been like they don't necessarily.
So I want to talk more about why do we do machine learning? What's the point? And to answer this question, I'm going to put this PowerPoint in the GitHub repo so you can have a look. I want to show you something really important which is examples of how people have used machine learning mainly in business, because that's where most of you are probably going to end up after this is working for some company.
I'm going to show you applications of machine learning which are either based on things that I've been personally involved in myself or know of people who are doing them directly, so none of these are going to be like hypotheticals, these are all actual things that people are doing and I've got direct or secondhand knowledge of.
I'm going to split them into two groups, horizontal and vertical. So in business, horizontal means something that you do across different kinds of business, whereas vertical means something that you do within a business or within a supply chain or within a process. So in other words, an example of horizontal applications is everything involving marketing.
So like every company pretty much has to try to sell more products to its customers, and so therefore does marketing. And so each of these boxes are examples of some of the things that people are using machine learning for in marketing. So let's take an example, let's take churn.
So churn refers to a model which attempts to predict who's going to leave. So I've done some churn modeling fairly recently in telecommunications, and so we're trying to figure out for this big cell phone company which customers are going to leave. That is not of itself that interesting, like building a highly predictive model that says during me how it is almost certainly going to leave next month is probably not that helpful because if I'm almost certainly going to leave next month, there's probably nothing you can do about it.
It's too late. What's going to cost you too much to keep me? So in order to understand why would we do churn modeling, I've got a little framework that you might find helpful. So if you Google for Jeremy Howard data products, I think I've mentioned this thing before, there's a paper you can find designing great data products that I wrote with a couple of colleagues a few years ago, and in it I describe my experience of actually turning machine learning models into stuff that makes money.
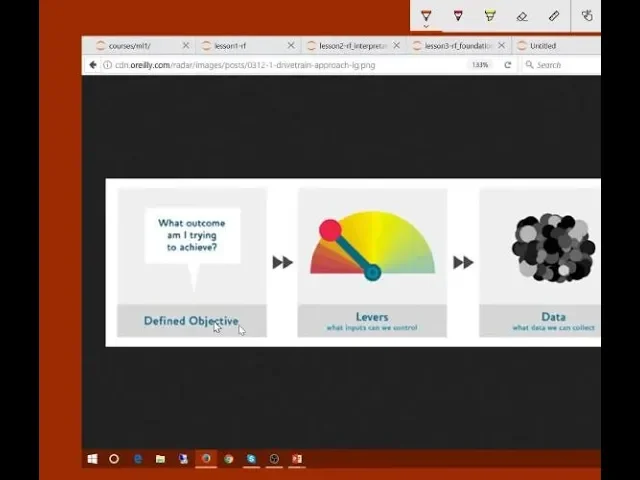
And the basic trick is this thing I call the drivetrain approach which is these four steps. The starting point to actually turn a machine learning project into something that's actually useful is to know what am I trying to achieve. And that doesn't mean I'm trying to achieve a high area under the ROC curve or I'm trying to achieve a large difference between classes.
No, it would be I'm trying to sell more books or I'm trying to reduce the number of customers that leave next month, or I'm trying to detect lung cancer earlier. These are things, these are objectives. So the objective is something that absolutely directly is the thing that the company or the organization actually wants.
No company or organization lives in order to create a more accurate predictive model, there's some reason. So that's your objective. Now that's obviously the most important thing. If you don't know the purpose of what you're modeling for, then you can't possibly do a good job of it. And hopefully people are starting to pick that up out there in the world of data science, but interestingly what very few people are talking about is just as important as the next thing, which is levers.
A lever is a thing that the organization can do to actually drive the objective. So let's take the example of churn modeling. What is a lever that an organization could use to reduce the number of customers that are leaving? They could take a closer look at the model and do some of this random forest interpretation and see some of the causes that are causing people to leave and potentially change those issues in the company form.
So that's a data scientist's answer, but I want you to go to the next level. What are the things, the levers are the things they can do? Do you want to put it past behind you? What are the things that they can do? They could call someone and say, "Are you happy with anything we can do?" Yeah, so they could give them a free pen or something if they buy 20 bucks worth of product next month.
You are going to do that as well? Okay, so you guys are the giving out carrots rather than handing out sticks. Do you want to send it over to a couple of guys? Yeah, you could give them a special. So these are levers, right? And so whenever you're working as a data scientist, keep coming back and thinking, "What are we trying to achieve, we being the organization, and how are we trying to achieve it being like what are the actual things we can do to make that objective happen?" So building a model is never ever a lever, but it could help you with the lever.
So then the next step is, what data does the organization have that could possibly help them to set that lever to achieve that objective? And so this is not what data did they give you when you started the project, but think about it from a first principle's point of view.
I'm working for a telecommunications company, they gave me some certain set of data, but I'm sure they must know where their customers live, how many phone calls they made last month, how many times they called customer service, whatever. And so have a think about, okay, if we're trying to decide who should we give a special offer to proactively, then we want to figure out what information do we have that might help us to identify who's going to react well or badly to that.
Perhaps more interestingly would be what if we were doing a fraud algorithm, and so we're trying to figure out who's going to not pay for the phone that they take out of the store, they're on some 12 month payment plan, we never see them again. Now in that case, the data we have available, it doesn't matter what's in the database, what matters is what's the data that we can get when the customer is in the shop.
So there's often constraints around the data that we can actually use. So we need to know what am I trying to achieve, what can this organization actually do specifically to change that outcome, and at the point that that decision is being made, what data do they have or could they collect.
And so then the way I put that all together is with a model, and this is not a model in the sense of a predictive model, but it's a model in the sense of a simulation model. So one of the main examples I give in this paper is one I spent many years building, which is if an insurance company changes their prices, how does that impact their profitability?
And so generally your simulation model contains a number of predictive models. So I had, for example, a predictive model called an elasticity model that said for a specific customer, if we charge them a specific price for a specific product, what's the probability that they would say yes, both when it's new business and then a year later, what's the probability that they're new.
And then there's another predictive model which is what's the probability that they're going to make a claim, and how much is that claim going to be. And so you can combine these models together then to say if we change our pricing by reducing it by 10% for every body between 18 and 25, and we can run it through these models that combine together into a simulation, then the overall impact on our market share in 10 years time is x, and our cost is y, and our profit is z, and so forth.
So in practice, most of the time you really are going to care more about the results of that simulation than you do about the predictive model directly. But most people are not doing this effectively at the moment. So for example, when I go to Amazon, I read all of Douglas Adams' books.
And so having read all of Douglas Adams' books, the next time I went to Amazon, they said would you like to buy the collected works of Douglas Adams? This is after I had bought every one of his books. So from a machine learning point of view, some data scientist had said people that buy one of Douglas Adams' books often go on to buy the collected works, but recommending to me that I buy the collected works of Douglas Adams isn't smart.
And it's actually not smart at a number of levels. Not only is it unlikely that I'm going to buy a box set of something of which I have every one individually, but furthermore, it's not going to change my buying behavior. I already know about Douglas Adams, I already know I like him, so taking up your valuable web space to tell me hey, maybe you should buy more of the author who you're already familiar with and have bought lots of times isn't actually going to change my behavior.
So what if instead of creating a predictive model, Amazon had built an optimization model that could simulate and said if we show Jeremy this ad, how likely is he then to go on to buy this book? And if I don't show him this ad, how likely is he to go on to buy this book?
And so that's the counterfactual, the counterfactual is what would have happened otherwise. And then you can take the difference and say okay, what should we recommend him that is going to maximally change his behavior, so maximally result in more books. And so you'd probably say like oh, he's never bought me Terry Pratchett books, he probably doesn't know about Terry Pratchett, but lots of people that liked Douglas Adams did turn out to like Terry Pratchett, so let's introduce him to a new author.
So it's the difference between a predictive model on the one hand versus an optimization model on the other hand. So the two tend to go hand in hand, the optimization model basically is saying, well first of all we have a simulation model. The simulation model is saying in a world where we put Terry Pratchett's book on the front page of Amazon for Jeremy Howard, this is what would have happened.
He would have bought it with a 94% probability. And so that then tells us with this lever of what do I put on my homepage for Jeremy today, we say okay, all the different settings of that lever that put Terry Pratchett on the homepage has the highest simulated outcome.
And then that's the thing which maximizes our profit from Jeremy's visit to Amazon.com today. So generally speaking, your predictive models kind of feed in to this simulation model, but you've kind of got to think about how do they all work together. So for example, let's go back to Chern.
So I turn out that Jeremy Howard is very likely to leave his cell phone company next month. What are we going to do about it? Let's call him. And I can tell you, if my cell phone company calls me right now and says just calling to say we love you, I'd be like I'm canceling right now.
That would be a terrible idea. So again, you'd want a simulation model that says what's the probability that Jeremy is going to change his behavior as a result of calling him right now. So one of the levers I have is call him. On the other hand, if I got a piece of mail tomorrow that said for each month you stay with us, we're going to give you $100,000, okay, then that's going to definitely change my behavior.
But then feeding that into the simulation model, it turns out that overall that would be an unprofitable choice to make. So do you see how all this fits in together? So when we look at something like CHURM, we want to be thinking what are the levers we can pull, and so what are the kind of models that we could build with what kinds of data to help us pull those levers better to achieve our objectives.
And so when you think about it that way, you realize that the vast majority of these applications are not largely about a predictive model at all, they're about interpretation, they're about understanding what happens if. So if we kind of take the intersection between on the one hand, here are all the levers that we could pull, here are all the things we can do, and then here are all of the features from our random forest feature importance that turn out to be strong drivers of the outcome.
And so then the intersection of those is here are the levers we could pull that actually matter because if you can't change the thing, then it's not very interesting. And if it's not actually a significant driver, it's not very interesting. So we can actually use our random forest feature importance to tell us what can we actually do to make a difference.
And then we can use the partial dependence to actually build this kind of simulation model to say like okay, well if we did change that, what would happen? So there are examples, lots and lots of these vertical examples. And so what I want you to kind of think about as you think about the machine learning problems you're working on is like why does somebody care about this?
And what would a good answer to them look like and how could you actually positively impact this business? So if you're creating like a Kaggle kernel, try to think about from the point of view of the competition organizer, like what would they want to know? And how can you give them that information?
So something like fraud detection, on the other hand, you probably just basically want to know who's fraudulent. So you probably do just care about the predictive model, but then you do have to think carefully about the data availability here. So it's like okay, but we need to know who's fraudulent at the point that we're about to deliver them a product.
So it's no point like looking at data that's available like a month later, for instance. So you've kind of got this key issue of thinking about the actual operational constraints that you're working under. Lots of interesting applications in human resources, but like employee churn, it's another kind of churn model where finding out that Jeremy Howard's sick of lecturing, he's going to leave tomorrow, what are you going to do about it?
Well knowing that wouldn't actually be helpful, it'd be too late, right? You would actually want a model that said what kinds of people are leaving USF? And it turns out that everybody that goes to the downstairs cafe leaves USF, I guess their food is awful, or whatever, or everybody that we're paying less than half a million dollars a year is leaving USF because they can't afford basic housing in San Francisco.
So you could use your employee churn model not so much to say which employees hate us, but why do employees leave? And so again, it's really the interpretation there that matters. Now lead prioritization is a really interesting one, right? This is one where a lot of companies, yes, Dana, can you pass that over there?
Yes, so I was just wondering, so for the churn thing, you suggested so one way is being an employee, like one million a year or something, but then it sounds like there are two predictors that you need to predict for, one being churn and one you need to optimize for your profit thing.
So how does it work in that? Yeah, exactly. So this is what this simulation model is all about, so it's a great question. So you kind of figure out this objective we're trying to maximize which is like company profitability, you can kind of create a pretty simple Excel model or something that says here's the revenues and here's the costs, and the cost is equal to the number of people we employ multiplied by their salaries, blah, blah, blah, blah, blah.
And so inside that kind of Excel model, there are certain cells, there are certain inputs where you're like oh, that thing's kind of stochastic, or that thing is kind of uncertain but we could predict it with a model. And so that's kind of what I do then is I then say okay, we need a predictive model for how likely somebody is to stay if we change their salary, how likely they are to leave with their current salary, how likely they are to leave next year if I increase their salary now, blah, blah, blah.
So you kind of build a bunch of these models and then you combine them together with simple business logic and then you can optimize that. You can then say okay, if I pay Jeremy Howard half a million dollars, that's probably a really good idea, and if I pay him less then it's probably not, or whatever.
You can figure out the overall impact. So it's really shocking to me how few people do this. Most people in industry measure their models using like AUC or RMSE or whatever, which is never actually what you want. Yes, can you pass it over here? I wanted to stress a point that you made before.
In my experience, a lot of the problem was to define the problem, right? So you are in a company, you're talking to somebody that doesn't have like this mentality that you have. They don't know that you have to have X and Y and so on. So you have to try to get that out of them.
What exactly do you want and try to go through a few iterations of understanding what they want and then you know the data, you know what the data is. You know actually where you can measure, which is often know what they want. So you have to kind of get a proxy for what they want.
And then so a lot of what you do is not that much of like, well, some people do actually just work on really good models for, but a lot of people also just work on this kind of how do you put this as a classification regression or some other type of modeling.
That's actually kind of the most interesting I think and also kind of what you have to do well. Yeah, the best people do both. Understand the technical model building deeply, but also understand the kind of strategic context deeply. And so this is one way to think about it. And as I say, I actually think there aren't many articles I wrote in 2012 I'm still recommending, but this one I think is still equally valid today.
So yeah, so like another great example is lead prioritization, right? So like a lot of companies, like every one of these boxes I'm showing, you can generally find a company or many companies whose sole job in life is to build models of that thing. So there are lots of companies that sell lead prioritization systems.
But again, the question is, how would we use that information? So if it's like, oh, our best lead is Jeremy, he's our highest probability of buying, does that mean I should send a salesperson out to Jeremy or I shouldn't? Like if he's highly probable to buy, why waste my time with him?
So again, it's like he really wants some kind of simulation that says what's the likely change in Jeremy's behavior if I send my best salesperson, Yannette, out to go and encourage him to sign. So yeah, I think there are many, many opportunities for data scientists in the world today to move beyond predictive modeling to actually bringing it all together with the kind of stuff that Dina was talking about in her question.
So as well as these horizontal applications that basically apply to every company, there's a whole bunch of applications that are specific to every part of the world. So for those of you that end up in healthcare, some of you will become experts in one or more of these areas, like readmission risk.
So what's the probability that this patient is going to come back to the hospital? And readmission is, depending on the details of the jurisdiction and so forth, it can be a disaster for hospitals when somebody is readmitted. So if you find out that this patient has a high probability of readmission, what do you do about it?
Well again, the predictive model is helpful of itself, it rather suggests that we just shouldn't send them home yet because they're going to come back. But wouldn't it be nice if we had the tree interpreter and it said to us the reason that they're at high risk is because we don't have a recent EKG for them, and without a recent EKG we can't have a high confidence about their cardiac health.
In which case it wouldn't be like, let's keep them in the hospital for two weeks, it would be like let's give them an EKG. So this is interaction between interpretation and predictive accuracy. What I'm understanding you saying is that the predictive models are a really great starting point, but in order to actually answer these questions we really need to focus on the interpretability of these models.
Yeah, I think so, and more specifically I'm saying we just learned a whole raft of random forest interpretation techniques and so I'm trying to justify why, and so the reason why is because actually maybe most of the time the interpretation is the thing we care about, and you can create a chart or a table without machine learning, and indeed that's how most of the world works.
Most managers build all kinds of tables and charts without any machine learning behind them. But they often make terrible decisions because they don't know the feature importance of the objective they're interested in, so the table they create is of things that actually are the least important things anyway, or they just do a univariate chart rather than a partial dependence plot so they don't actually realize that the relationship they thought they're looking at is due entirely to something else.
So I'm kind of arguing for data scientists getting much more deeply involved in strategy and in trying to use machine learning to really help a business with all of its objectives. There are companies like Dunhumbi, a huge company that does nothing but retail applications of machine learning, and so I believe there's a Dunhumbi product you can buy which will help you figure out if I put my new store in this location versus that location, how many people are going to shop there?
Or if I put my diapers in this part of the shop versus that part of the shop, how's that going to impact purchasing behavior or whatever? So I think it's also good to realize that the subset of machine learning applications you tend to hear about in the tech press or whatever is this massively biased tiny subset of stuff which Google and Facebook do, whereas the vast majority of stuff that actually makes the world go round is these kinds of applications that actually help people make things, buy things, sell things, build things, so forth.
So about tree interpretation, the way we looked at the tree was we manually checked which feature was more important for particular observation, but for businesses they would have huge amount of data and they want this interpretation for a lot of observations. So how do they automate it? I don't think the automation is at all difficult, you can run any of these algorithms like looping through the rows or throwing them in parallel, it's all just code, am I misunderstanding your question?
Is it like they set a threshold that if some feature is above, like for different people will have different behavior? This is a really important issue actually, the vast majority of machine learning models don't automate anything, they're designed to provide information to humans. So for example, if you're a point of sales customer service phone operator for an insurance company and your customer asks you why is my renewal $500 more expensive than last time, then hopefully the insurance company provides in your terminal a little screen that shows the result of the tree interpreter or whatever so that you can jump there and tell the customer, okay, well here's last year, you're in this different zip code which has lower amounts of car theft and this year also you've actually changed your vehicle to a more expensive one or whatever.
So it's not so much about thresholds and automation, but about making these model outputs available to the decision makers in an organization, whether they be at the top strategic level of like, are we going to shut down this whole product or not, all the way to the operational level of that individual discussion with a customer.
So another example is aircraft scheduling and gate management, there's lots of companies that do that, and basically what happens is that there are people at an airport whose job it is to basically tell each aircraft what gate to go to to figure out when to close the doors, stuff like that.
So the idea is you're giving them software which has the information they need to make good decisions. So the machine learning models end up embedded in that software, if I'm going to say, okay, that plane that's currently coming in from Miami, there's a 48% chance that it's going to be over 5 minutes late, and if it does, then this is going to be the knock-on impact through the rest of the terminal, for instance.
So that's kind of how these things tend to fit together. So there's so many of these, there's lots and lots, and so I don't expect you to remember all these applications, but what I do want you to do is spend some time thinking about them, like sit down with one of your friends and talk about a few examples, like okay, how would we go about doing failure analysis and manufacturing, who would be doing that, why would they be doing it, what kind of models might they use, what kind of data might they use.
Start to kind of practice this and get a sense, because then as you're interviewing and then when you're at the workplace and you're talking to managers, you want to be straight away able to kind of recognize that the person you're talking to, what do they try to achieve, what are the levers that they have to pull, what are the data they have available to pull those levers to achieve that thing, and therefore, how could we build models to help them do that and what kind of predictions would they have to be making.
And so then you can have this really thoughtful, empathetic conversation with those people saying like hey, in order to reduce the number of customers that are leaving, I guess you're trying to figure out who should you be providing better pricing to or whatever, and so forth. So what I'm noticing from your beautiful little chart above is that a lot of this, to me at least, still seems like the primary purpose is at least base level, is predictive power.
And so I guess my thing is for explanatory problems, a lot of the ones that people are faced with in social sciences, is that something machine learning can be used for or is used for or is that not really the realm that it is? That's a great question, and I've had a lot of conversations about this with people in social sciences, and currently machine learning is not well applied in economics or psychology or whatever on the whole.
But I'm convinced it can be, for the exact reasons we're talking about. So if you're trying to figure out, if you're trying to do some kind of behavioral economics and you're trying to understand why some people behave differently to other people, a random forest with a feature importance plot would be a great way to start.
Or more interestingly, if you're trying to do some kind of sociology experiment or analysis based on a large social network dataset where you have an observational study, you really want to try and pull out all of the sources of exogenous variables, all the stuff that's going on outside. And so if you use a partial dependence plot with a random forest, that happens automatically.
So I actually gave a talk at MIT a couple of years ago for the first conference on digital experimentation which was really talking about how do we experiment in things like social networks and these digital environments. Economists all do things with classic statistical tests, but in this case the economists I talked to were absolutely fascinated by this and they actually asked me to give an introduction to machine learning session at MIT to these various faculty and graduate folks in the economics department.
And some of those folks have gone on to write some pretty famous books and stuff, so hopefully it's been useful. So it's definitely early days, but it's a big opportunity. But as Yannette says, there's plenty of skepticism still out there. Well the skepticism comes from unfamiliarity basically with this totally different approach.
So if you've spent 20 years studying econometrics and somebody comes along and says, "Here's a totally different approach to all the stuff that econometricians do," naturally your first reaction will be like, "Prove it!" So that's fair enough. Over time the next generation of people who are growing up with machine learning, some of them will move into the social sciences, they'll make huge impacts that nobody's ever managed to make before, and people will start going, "Wow!" Just like happened in computer vision, when computer vision spent a long time of people saying like, "Hey, maybe you should use deep learning for computer vision," and everybody in computer vision is like, "Prove it!" We have decades of work on amazing feature detectors for computer vision, and then finally in 2012 Hinton and Kudresky came along and said, "Okay, our model is twice as good as yours and we've only just started on this," and everybody was like, "Oh, okay, that's pretty convincing." Nowadays every computer vision researcher basically uses deep learning.
I think that time will come in this area too. I think what we might do then is take a break and we're going to come back and talk about these random forest interpretation techniques and do a bit of a review. So let's come back at 2 o'clock. So let's have a go at talking about these different random forest interpretation methods, having talked about why they're important.
So let's now remind ourselves what they are. So I've got to let you folks have a go. So let's start with confidence based on tree variance. So can one of you tell me one or more of the following things about confidence based on tree variance? What does it tell us?
Why would we be interested in that and how is it calculated? This is going back a ways because it was the first one we looked at. Even if you're not sure or you only know a little piece of it, give us your piece and we'll build on it together.
I think I got a piece of it. It's getting the variance of our predictions from random forests. That's true. That's the how. Can you be more specific? So what is it the variance of? I think it's, if I'm remembering correctly, I think it's just the overall prediction. The variance of the predictions of the trees, yes.
So normally the prediction is just the average, this is the variance of the trees. So it kind of just gives you an idea of how much your prediction is going to vary. So maybe you want to minimize variance, maybe that's your goal for whatever reason that could be. That's not so much the reason, so I like your calculation description.
Let's see if somebody else can tell us how you might use that. It's okay if you're not sure, have a step. So I remember that we talked about kind of the independence of the trees and so maybe something about if the variance of the trees is higher or lower than.
That's not so much that, that's an interesting question but it's not what we're going to see here. I'm going to pass it back behind you. So to remind you, just to fill in a detail here, what we generally do here is we take just one row, like one observation often, and find out how confident we are about that, like how much variance there are in the trees for that, or we can do it as we did here for different groups.
So according to me the idea is like for each row we calculate the standard deviation that we get from the random forest model, and then maybe group according to different variables or predictors, and see for which particular predictor the standard deviation is high, and then go deep down as why it is happening, maybe it is because a particular category of that variable has very less number of observations.
Yeah, that's great. So that would be one approach is kind of what we've done here is to say like is there any groups where we're very unconfident? Something that I think is even more important would be when you're using this operationally, let's say you're doing a credit decisioning algorithm.
So we're trying to say is Jeremy a good risk or a bad risk? Should we loan him a million dollars? And the random forest says, I think he's a good risk, but I'm not at all confident. In which case we might say maybe I shouldn't give him a million dollars, or else if the random forest said, I think he's a good risk, I am very sure of that, then we're much more comfortable giving him a million dollars.
And I'm a very good risk, so feel free to give me a million dollars. I checked the random forest before a different notebook, not in the repo. So it's quite hard for me to give you folks direct experience with this kind of single observation interpretation stuff, because it's really like the kind of stuff that you actually need to be putting out to the front line.
It's not something which you can really use so much in a kind of Kaggle context, but it's more like if you're actually putting out some algorithm which is making big decisions that could cost a lot of money, you probably don't so much care about the average prediction of the random forest, but maybe you actually care about like the average minus a couple of standard deviations, like what's the kind of worst-case prediction.
And so as Chika mentioned, it's like maybe there's a whole group that we're kind of unconfident about. So that's confidence based on tree variance. Alright, who wants to have a go at answering feature importance? What is it? Why is it interesting? How do we calculate it or any subset thereof?
I think it's basically to find out which features are important for your model. So you take each feature and you randomly sample all the values in the feature and you see how the predictions are, if it's very different. It means that that feature was actually important, else if it's fine to take any random values for that feature, it means that maybe probably it's not very important.
Okay, that was terrific. That was all exactly right. There were some details that maybe were skimmed over a little bit. I wonder if anybody else wants to jump into like a more detailed description of how it's calculated because I know this morning some people were not quite sure. Is there anybody who's not quite sure maybe who wants to like have a go or want to just put it next to you there?
Let's see. How exactly do we calculate feature importance for a particular feature? I think after you're done building the random forest model, you take each column and randomly shuffle it and generate a prediction and check the validation score. If it gets pretty bad for after shuffling one of the columns, that means that column was important.
So that has higher importance. I'm not exactly sure how we quantify the feature importance. Okay, great. Dina, do you know how we quantify the feature importance? That was a great description. I think we did the difference in the class square. Or score of some sort, exactly, yeah. So let's say we've got our dependent variable which is price, right, and there's a bunch of independent variables including year made, right.
And so basically we use the whole lot to build a random forest, right, and then that gives us our predictions, right. And so then we can compare that to get R^2, RMSE, whatever you're interested in from the model. Now the key thing here is I don't want to have to retrain my whole random forest.
That's kind of slow and boring, right. So using the existing random forest, how can I figure out how important year made was, right. And so the suggestion was, let's randomly shuffle the whole column, right. So now that column is totally useless. It's got the same mean, same distribution, everything about it is the same, but there's no connection at all between particular people, actual year made, and what's now in that column.
I've randomly shuffled it, okay. And so now I put that new version through with the same random forest, so there's no retraining done, okay, to get some new Y hat, I call it Y hat, YM, right. And then I can compare that to my actuals to get like an RMSE, YM, right.
And so now I can start to create a little table. So now I can create a little table where I've basically got like the original here, RMSE, and then I've got with year made scrambled, so this one had an RMSE of like 3, this one had an RMSE of like 2, enclosure, scrambling that had an RMSE of like 2.5, right.
And so then I just take these differences. So I'd say year made, the importance is 1, 3 - 2, enclosure is 0.5, 3 - 2.5, and so forth. So how much worse did my model get after I shuffled that variable? Does anybody have any questions about that? Can you pass that to Danielle please?
"I assume you just chose those numbers randomly, but my question I guess is do all of them theoretically not a perfect model to start out with, like will all the importance is sub to 1 or is that not?" No, honestly I've never actually looked at what the units are, so I'm actually not quite sure.
Sorry, we can check it out during the week if somebody's interested. Have a look at this SKLearn code and see exactly what those units of measure are because I've never bothered to check. Although I don't check like the units of measure specifically, what I do check is the relative importance.
And so like here's an example, so rather than just saying like what are the top 10, yesterday one of the Tracticum students asked me about a feature importance where they said like oh I think these 3 are important. And I pointed out that the top one was a thousand times more important than the second one.
So like look at the relative numbers here. And so in that case it's like no don't look at the top 3, look at the one that's a thousand times more important and ignore all the rest. And so this is where sometimes the kind of your natural tendency to want to be like precise and careful, you need to override that and be very practical.
Like okay this thing's a thousand times more important, don't spend any time on anything else. So then you can go and talk to the manager of your project and say like okay this thing's a thousand times more important. And then they might say oh that was a mistake, it shouldn't have been in there, we don't actually have that information at the decision time.
For whatever reason we can't actually use that variable and so then you could remove it and have a look. Or they might say gosh I had no idea that was by far more important than everything else put together. So let's forget this random virus thing and just focus on understanding how we can better collect that one variable and better use that one variable.
So that's like something which comes up quite a lot. And actually another place that came up just yesterday, again another practicum student asked me hey I'm doing this medical diagnostics project and my R^2 is 0.95 for a disease which I was told is very hard to diagnose. Is this random forest a genius or is something going wrong?
And I said like remember the second thing you do after you build a random forest is to do feature importance. So do feature importance and what you'll probably find is that the top column is something that shouldn't be there. And so that's what happened. He came back to me half an hour later, he said yeah I did the feature importance, you were right, the top column was basically something that was another encoding of the dependent variable, I've removed it, and now my R^2 is -0.1 so that's an improvement.
The other thing I like to look at is this chart, is to basically say where do things flatten off in terms of which ones should I be really focusing on. So that's the most important one. And so when I did credit scoring in telecommunications, I found there were 9 variables that basically predicted very accurately who was going to end up paying for their phone and who wasn't.
And apart from ending up with a model that saved them $3 billion a year in fraud and credit costs, it also let them basically rejig their process so that they focused on collecting those 9 variables much better. Alright, who wants to do partial dependence? This is an interesting one, very important, but in some ways kind of tricky to think about.
I'll go ahead and try. Yeah please do. So from my understanding of what partial dependence is is that there's not always necessarily like a relationship between strictly the dependent variable and this independent variable that necessarily is showing importance, but rather an interaction between two variables that are working together.
You're coming like this, right? Yeah. Where we're like, oh that's weird. I could expect this to be kind of flattened as a weird hokey day. Yeah. And so for this example, what we found was that it's not necessarily your maid or when the sale was elapsed, but it's actually the age of the model.
And so that is easier to tell a company, well obviously your younger models are going to sell for more, and it's less about when the year was made. Yeah, exactly. So let's come back to how we calculate this in a moment, but the first thing to realize is that the vast majority of the time post your course here, when somebody shows you a chart, it will be like a univariate chart.
They'll just grab the data from the database and they'll plot x against y, and then managers have a tendency to want to make a decision. So it'll be like, oh there's this drop-off here, so we should stop dealing in equipment made between 1990 and 1995 or whatever. And this is a big problem because real-world data has lots of these interactions going on, so maybe there was a recession going on around the time those things were being sold or maybe around that time people were buying more of a different type of equipment or whatever.
So generally what we actually want to know is all other things being equal, what's the relationship between year made and sale price. Because if you think about the drivetrain approach idea of the levers, you really want a model that says if I change this lever, how will it change my objective?
And so it's by pulling them apart using partial dependence that you can say, okay, actually this is the relationship between year made and sale price, all other things being equal. So how do we calculate that? So for the variable year made, for example, you're going to train, you keep every other variable constant and then you're going to pass every single value of the year made and then train the model after that.
So for every model you're going to have the light blue for the values of it and the median is going to be the yellow line up there. Okay, so let's try and draw that. By leave everything else constant, what she means is leave them at whatever they are in the dataset.
So just like when we did feature importance, we're going to leave the rest of the dataset as it is, and we're going to do partial dependence plot for year made. So you've got all of these other rows of data that will just leave as they are. And so instead of randomly shuffling year made, instead what we're going to do is replace every single value with exactly the same thing, 1960.
And just like before, we now pass that through our existing random forest, which we have not retrained or changed in any way, to get back out a set of predictions. Why 1960? And so then we can plot that on a chart, year made against partial dependence, 1960 here. Now we can do it for 1961, 2, 3, 4, 5, and so forth.
And so we can do that on average for all of them, or we could do it just for one of them. And so when we do it for just one of them and we change its year made and pass that single thing through our model, that gives us one of these blue lines.
So each one of these blue lines is a single row as we change its year made from 1960 up to 2008. And so then we can just take the median of all of those blue lines to say, on average, what's the relationship between year made and price, all other things being equal.
So why is it that this works? Why is it that this process tells us the relationship between year made and price, all other things being equal? Well, maybe it's good to think about a really simplified approach. A really simplified approach would say, what's the average auction? What's the average sale date?
What's the most common type of machine we sell? Which location do we mostly sell things? We could come up with a single row that represents the average auction, and then we could say, let's run that row through the random forest, replace its year made with 1960, and then do it again with 1961, and then do it again with 1962, and we could plot those on our little chart.
And that would give us a version of the relationship between year made and sale price, all other things being equal. But what if tractors looked like that and backhoe loaders looked like that? Then taking the average one would hide the fact that there are these totally different relationships. So instead we basically say, our data tells us what kinds of things we tend to sell, and who we tend to sell them to, and when we tend to sell them, so let's use that.
So then we actually find out, for every blue line, here are actual examples of these relationships. And so then what we can do, as well as plotting the median, is we can do a cluster analysis to find out like a few different shapes. And so we may find, in this case they all look like pretty much the different versions of the same thing with different slopes.
So my main takeaway from this would be that the relationship between sale price and year is basically a straight line. And remember, this was log of sale price, so this is actually showing us an exponential. And so this is where I would then bring in the domain expertise, which is like, okay, things depreciate over time by a constant ratio, so therefore I would expect older stuff year made to have this exponential shape.
So this is where I kind of mentioned the very start of my machine learning project, I generally try to avoid using as much domain expertise as I can and let the data do the talking. So one of the questions I got this morning was, if there's like a sale ID, a model ID, I should throw those away because they're just IDs.
No, don't assume anything about your data, leave them in, and if they turn out to be super important predictors, you want to find out why is that. But then, now I'm at the other end of my project, I've done my feature importance, I've pulled out the stuff which is from that dendrogram, the kind of redundant features, I'm looking at the partial dependence, and now I'm thinking, okay, is this shape what I expected?
So even better, before you plot this, first of all think, what shape would I expect this to be? It's always easy to justify to yourself after the fact, I knew it would look like this. So what shape do you expect, and then is it that shape? So in this case, I'd be like, yeah, this is what I would expect, whereas this is definitely not what I'd expect.
So the partial dependence plot has really pulled out the underlying truth. So does anybody have any questions about why we use partial dependence or how we calculate it? If there are 20 features that are important, then I will do the partial dependence for all of them, where important means it's a lever I can actually pull, the magnitude of its size is not much smaller than the other 19, based on all of these things, it's a feature I ought to care about, then I will want to know how it's related.
It's pretty unusual to have that many features that are important both operationally and from a modeling point of view, in my experience. So important means it's a lever, so it's something I can change, and it's like, you know, kind of at the spiky end of this tail. Or maybe it's not a lever directly, maybe it's like zip code, and I can't actually tell my customers where to live, but I could focus my new marketing attention on a different zip code.
Would it make sense to do pairwise shuffling for every combination of two features and hold everything else constant, like in feature importance, to see interactions and compare scores? So you wouldn't do that so much for partial dependence. I think your question is really getting to the question of could we do that for feature importance.
So I think interaction feature importance is a very important and interesting question. But doing it by randomly shuffling every pair of columns, if you've got 100 columns, sounds computationally intensive, possibly infeasible. So what I'm going to do is after we talk about TreeInterpreter, I'll talk about an interesting but largely unexplored approach that will probably work.
Okay, who wants to do TreeInterpreter? Alright, over here, Prince. Can you pass that over here to Prince? I was thinking this to be more like feature importance, but feature importance is for complete random forest model, and this TreeInterpreter is for feature importance for particular observation. So if that, let's say it's about hospital readmission, so if a patient A1 is going to be readmitted to a hospital, which feature for that particular patient is going to impact?
And how can you change that? And it is calculated starting from the prediction of mean, then seeing how each feature is changing the behavior of that particular patient. I'm smiling because that was one of the best examples of technical communication I've heard in a long time. So it's really good to think about why was that effective.
So what Prince did there was he used as specific an example as possible. Humans are much less good at understanding abstractions. So if you say it takes some kind of feature and then there's an observation in that feature where it's like, no, it's a hospital readmission. So we take a specific example.
The other thing he did that was very effective was to take an analogy to something we already understand. So we already understand the idea of feature importance across all of the rows in a dataset. So now we're going to do it for a single row. So one of the things I was really hoping we would learn from this experience is how to become effective technical communicators.
So that was a really great role model from Prince of using all of the tricks we have at our disposal for effective technical communication. So hopefully you found that a useful explanation. I don't have a hell of a lot to add to that other than to show you what that looks like.
So with the tree interpreter, we picked out a row. And so remember when we talked about the confidence intervals at the very start, the confidence based on tree variance, we mainly said you'd probably use that for a row. So this would also be for a row. So it's like, okay, why is this patient likely to be readmitted?
So here is all of the information we have about that patient, or in this case this auction. Why is this auction so expensive? So then we call tree interpreter dot predict, and we get back the prediction of the price, the bias, which is the root of the tree. So this is just the average price for everybody, so this is always going to be the same.
And then the contributions, which is how important is each of these things. And so the way we calculated that was to say at the very start, the average price was 10, and then we split on enclosure. And for those with this enclosure, the average was 9.5. And then we split on year made, I don't know, less than 1990.
And for those with that year made, the average price was 9.7. And then we split on the number of hours on the meter, and for this branch we got 9.4. And so we then have a particular option, which we pass it through the tree, and it just so happens that it takes this path.
So one row can only have one path through the tree. And so we ended up at this point. So then we can create a little table. And so as we go through, we start at the top, and we start with 10. That's our bias. And we said enclosure resulted in a change from 10 to 9.5, minus 0.5.
Year made changed it from 9.5 to 9.7, so plus 0.2. And then meter changed it from 9.7 down to 9.4, which is minus 0.3. And then if we add all that together, 10 minus 1/2 is 9.5, plus 0.2 is 9.7, minus 0.3 is 9.4. Lo and behold, that's that number, which takes us to our Excel spreadsheet.
Where's Chris, who did our waterfall? There you are. So last week we had to use Excel for this because there isn't a good Python library for doing waterfall charts. And so we saw we got our starting point, this is the bias, and then we had each of our contributions and we ended up with our total.
The world is now a better place because Chris has created a Python waterfall chart module for us and put it on pip, so never again will we have to use Excel for this. And I wanted to point out that waterfall charts have been very important in business communications at least as long as I've been in business, so that's about 25 years.
Python is a couple of decades old, a little bit less, maybe a couple of decades old. But despite that, no one in the Python world ever got to the point where they actually thought I'm going to make a waterfall chart. So they didn't exist until two days ago, which is to say the world is full of stuff which ought to exist and doesn't, and doesn't necessarily take ahead a lot of time to build.
Chris, how did it take you to build the first Python waterfall chart? Well there was a gist of it, so a hefty time amount but not unreasonable. And now forevermore, people when they want the Python waterfall chart will end up at Chris's GitHub repo and hopefully find lots of other USF contributors who have made it even better.
So in order for you to help improve Chris's Python waterfall, you need to know how to do that. And so you're going to need to submit a pull request. Life becomes very easy for submitting pull requests if you use something called hub. So if you go to github/hub, that will send you over here.
And what they suggest you do is that you alias git to hub, because it turns out that hub actually is a strict superset of git. But what it lets you do is you can go git fork, git push, git pull request, and you've now sent Chris a pull request.
Without hub, this is actually a pain and requires going to the website and filling in forms. So this gives you no reason not to do pull requests. And I mention this because when you're interviewing for a job or whatever, I can promise you that the person you're talking to will check your GitHub.
And if they see you have a history of submitting thoughtful pull requests that are accepted to interesting libraries, that looks great. It looks great because it shows you're somebody who actually contributes. It also shows that if they're being accepted, that you know how to create code that fits with people's coding standards, has appropriate documentation, passes their tests and coverage, and so forth.
So when people look at you and they say, "Oh, here's to somebody with a history of successfully contributing accepted pull requests to open-source libraries," that's a great part of your portfolio. And you can specifically refer to it. So either I'm the person who built Python Waterfall, here is my repo, or I'm the person who contributed currency number formatting to Python Waterfall, here's my pull request.
Any time you see something that doesn't work right in any open-source software you use is not a problem. It's a great opportunity because you can fix it and send in the pull request. So give it a go, it actually feels great the first time you have a pull request accepted.
And of course, one big opportunity is the FastAI library. Was the person here the person who added all the docs to FastAI structured in the other class? Okay. So thanks to one of our students, we now have doc strings for most of the fastai.structured library and that again came via a pull request.
So thank you. Does anybody have any questions about how to calculate any of these random forest interpretation methods or why we might want to use any of these random forest interpretation methods? Towards the end of the week, you're going to need to be able to build all of these yourself from scratch.
Just looking at the tree interpreter, I noticed that some of the values are NINs. I get why you keep them in the tree, but how can an NIN have a feature importance? Okay let me pass it back to you. Why not? So, in other words, how is NIN handled in pandas and therefore in the tree?
Is that to some default value? Anybody remember how pandas, notice these are all in categorical variables, how does pandas handle NINs in categorical variables and how does FastAI deal with them? Can somebody pass it to the person who's talking? Pandas sets them to -1, category code, and do you have to remember what we then do?
We add 1 to all of the category codes, so it ends up being 0. So in other words, we have a category with, remember by the time it hits the random forest it's just a number, and it's just a number 0. And we map it back to the descriptions back here.
So the question really is, why shouldn't the random forest be able to split on 0? It's just another number. So it could be NIN, high, medium, or low, 0, 1, 2, 3, 4. And so missing values are one of these things that are generally taught really badly, like often people get taught like here are some ways to remove columns with missing values or remove rows with missing values or to replace missing values.
That's never what we want, because missingness is very very very often interesting. And so we actually learned from our feature importance that coupler system NIN is like one of the most important features. And so for some reason, I could guess, right? Coupler system NIN presumably means this is the kind of industrial equipment that doesn't have a coupler system.
I don't know what kind that is, but apparently it's a more expensive kind. Does that make sense? So I did this competition for university grant research success where by far the most important predictors were whether or not some of the fields were null, and it turned out that this was data leakage, that these fields only got filled in most of the time after a research grant was accepted.
So it allowed me to win that Kaggle competition, but it didn't actually help the university very much. Okay, great. So let's talk about extrapolation, and I am going to do something risky and dangerous, which is we're going to do some live coding. And the reason we're going to do some live coding is I want to explore extrapolation together with you, and I kind of also want to help give you a feel of how you might go about writing code quickly in this notebook environment.
And this is the kind of stuff that you're going to need to be able to do in the real world, and in the exam is quickly create the kind of code that we're going to talk about. So I really like creating synthetic data sets anytime I'm trying to investigate the behavior of something, because if I have a synthetic data set, I know how it should behave.
Which reminds me, before we do this, I promised that we would talk about interaction importance, and I just about forgot. Tree interpreter tells us the contributions for a particular row based on the difference in the tree. We could calculate that for every row in our data set and add them up, and that would tell us feature importance in a different way.
One way of doing feature importance is by shuffling the columns one at a time, and another way is by doing tree interpreter for every row and adding them up. Neither is more right than the others, they're actually both quite widely used. So this is type 1 and type 2 feature importance.
So we could try to expand this a little bit, to do not just single variable feature importance, but interaction feature importance. Now here's the thing, what I'm going to describe is very easy to describe. It was described by Brimann right back when random forests were first invented, and it is part of the commercial software product from Salford Systems who have the trademark on random forests, but it is not part of any open source library I'm aware of.
And I've never seen an academic paper that actually studies it closely. So what I'm going to describe here is a huge opportunity, but there's also lots and lots of details that need to be fleshed out. But here's the basic idea. This particular difference here is not just because of year made, but because of a combination of year made and enclosure.
The fact that this is 9.7 is because enclosure was in this branch and year made was in this branch. So in other words, we could say the contribution of enclosure interacted with year made is -0.3. And so what about that difference? Well that's an interaction of year made and hours on the meter.
So year made interacted with, I'm using star here not to mean times, but to mean interacted with. It's kind of a common way of doing things, like R's formulas do it this way as well. Year made by interacted with meter has a contribution of -0.1. Perhaps we could also say from here to here that this also shows an interaction between meter and enclosure, with one thing in between them.
So maybe we could say meter by enclosure equals, and then what should it be? Should it be -0.6? In some ways that kind of seems unfair because we're also including the impact of year made. So maybe it should be -0.6. Maybe we should add back this -0.2. And these are like details that I actually don't know the answer to.
How should we best assign a contribution to each pair of variables in this path? But clearly, conceptually, we can. The pairs of variables in that path all represent interactions. Yes, Chris, could you pass that to Chris, please? Why don't you force them to be next to each other in the tree?
I'm not going to say it's the wrong approach. I don't think it's the right approach, though, because it feels like this path here, meter and enclosure, are interacting. So it seems like not recognizing that contribution is throwing away information, but I'm not sure. I had one of my staff at Kaggle actually do some R&D on this a few years ago, and I wasn't close enough to know how they dealt with these details.
But they got it working pretty well, but unfortunately it never saw the light of day as a software product. But this is something which maybe a group of you could get together and build -- I mean, do some Googling to check, but I really don't think that there are any interaction feature importance parts of any open source library.
Could you pass that back? Wouldn't this exclude interactions between variables that don't matter until they interact? So say your row never chooses to split down that path, but that variable interacting with another one becomes your most important split. I don't think that happens, because if there's an interaction that's important only because it's an interaction and not on a univariate basis, it will appear sometimes assuming that you set max features to less than 1, and so therefore it will appear in some parts.
What is meant by interaction here? Is it multiplication, ratio, addition? Interaction appears on the same path through a tree, like in this case the tree there's an interaction between enclosure and UMA because we branch on enclosure and then we branch on UMA. So to get to here we have to have some specific value of enclosure and some specific value of UMA.
My brain is kind of working on this right now. What if you went down the middle leafs between the two things you were trying to observe and you would also take into account what the final measure is? So if we extend the tree downwards you'd have many measures, both of the two things you're trying to look at and also the in between steps.
There seems to be a way to like average information out in between them. There could be. So I think what we should do is talk about this on the forum. I think this is fascinating and I hope we build something great, but I need to do my live coding so let's -- yeah, that was a great discussion.
Keep thinking about it. Yeah, do some experiments. And so to experiment with that you almost certainly want to create a synthetic data set first. It's like y = x1 + x2 + x1 * x2 or something, like something where you know there's this interaction effect and there isn't that interaction effect and then you want to make sure that the feature importance you get at the end is what you expected.
And so probably the first step would be to do single variable feature importance using the tree interpreter style approach. And one nice thing about this is it doesn't really matter how much data you have, all you have to do to calculate feature importance is just slide through the tree.
So you should be able to write in a way that's actually pretty fast, and so even writing it in pure Python might be fast enough depending on your tree size. So we're going to talk about extrapolation. And so the first thing I want to do is create a synthetic data set that has a simple linear relationship.
We're going to pretend it's like a time series. So we need to basically create some x values. So the easiest way to kind of create some synthetic data of this type is to use LinSpace, which creates some evenly spaced data between start and stop with by default 50 observations.
So if we just do that, there it is. And so then we're going to create a dependent variable. And so let's assume there's just a linear relationship between x and y, and let's add a little bit of randomness to it. So uniform random between low and high, so we could add somewhere between -0.2 and 0.2.
And so the next thing we need is a shape, which is basically what dimensions do you want these random numbers to be. And obviously we want them to be the same shape as x's shape. So we can just say x.shape. Remember, when you see something in parentheses with a comma, that's a tuple with just one thing in it.
So this is of shape 50, and so we've added 50 random numbers. And so now we can plot those. So shift+tab, x, y. All right, so there's our data. So when you're both working as a data scientist or doing your exams in this course, you need to be able to quickly whip up a data set like that, throw it up on a plot without thinking too much.
And as you can see, you don't have to really remember much, if anything, you just have to know how to hit shift+tab to check the names of the parameters, and everything in the exam will be open on the internet, so you can always Google for something to try and find lin space if you've got what it's called.
So let's assume that's our data. And so we're now going to build a random forest model, and what I want to do is build a random forest model that kind of acts as if this is a time series. So I'm going to take this as a training set, I'm going to take this as our validation or test set, just like we did in groceries or bulldozers or whatever.
So we can use exactly the same kind of code that we used in split_bells. So we can basically say x train, x bell = x up to 40, x from 40. So that just splits it into the first 40 versus the last 10. And so we can do the same thing for y, and there we go.
So the next thing to do is we want to create a random forest and fit it, and that's going to require x's and y's. Now that's actually going to give an error, and the reason why is that it expects x to be a matrix, not a vector, because it expects x to have a number of columns of data.
So it's important to know that a matrix with one column is not the same thing as a vector. So if I try to run this, expect a 2D array, we've got a 1D array instead. So we need to convert our 2D array into a 1D array. So remember I said x.shape is 50, right?
So x has one axis. So it's important to make sure that x's rank is 1. The rank of a variable is equal to the length of its shape. How many axes does it have? So a vector we can think of as an array of rank 1, a matrix is an array of rank 2.
I very rarely use words like vector and matrix because they're kind of meaningless, specific examples of something more general, which is they're all n-dimensional tensors, or n-dimensional arrays. So an n-dimensional array, we can say it's a tensor of rank n, they basically mean kind of the same thing. Physicists get crazy when you say that because to a physicist a tensor has quite a specific meaning, but in machine learning we generally use it in the same way.
So how do we turn a 1-dimensional array into a 2-dimensional array? There's a couple of ways we can do it, but basically we slice it. So colon means give me everything in that axis, colon, none means give me everything in the first axis, which is the only axis we have, and then none is a special indexer, which means add a unit axis here.
So let me show you, that is of shape 50, 1, so it's of rank 2, it has two axes. One of them is a very boring axis, it's a length 1 axis, so let's move this over here. There's 1, 50, and then to remind you the original is just 50.
So you can see I can put none as a special indexer to introduce a new unit axis there. So this thing has 1 row and 50 columns, this thing has 50 rows and 1 column. So that's what we want, we want 50 rows and 1 column. This kind of playing around with ranks and dimensions is going to become increasingly important in this course and in the deep learning course.
So I spend a lot of time slicing with none, slicing with other things, trying to create 3-dimensional, 4-dimensional tensors and so forth. I'll show you a trick, I'll show you two tricks. The first is you never ever need to write comma, colon, it's always assumed. So if I delete that, this is exactly the same thing.
And you'll see that in code all the time, so you need to recognize it. The second trick is, this is adding an axis in the second dimension, or I guess the index 1 dimension. What if I always want to put it in the last dimension? And often our tensors change dimensions without us looking, because you went from a 1-channel image to a 3-channel image, or you went from a single image to a mini-batch of images.
Like suddenly you get new dimensions appearing. So to make things general, I would say this, dot dot dot. Dot dot dot means as many dimensions as you need to fill this up. And so in this case it's exactly the same thing, but I would always try to write it that way because it means it's going to continue to work as I get higher dimensional tensors.
So in this case, I want 50 rows in one column, so I'll call that say x_1. So let's now use that here. And so this is now a 2D array, and so I can create my random forest. So then I can plot that, and this is where you're going to have to turn your brains on, because the folks this morning got this very quickly, which was super impressive.
I'm going to plot y_train against m.predict x_train. Where I hit go, what is this going to look like? It should basically be the same. Our predictions hopefully are the same as the actuals, so this should fall on a line. But there's some randomness, so I should have used scatterplot.
So that's cool. That was the easy one. Let's now do the hard one, the fun one. What's that going to look like? So I'm going to say no, but nice try. It's like, hey, we're extrapolating to the validation. That's what I'd like it to look like, but that's not what it is going to look like.
Think about what trees do, and think about the fact that we have a validation set here and a training set here. So think about a forest is just a bunch of trees, so the first tree is going to have a go. Can you pass that to Melissa? >> Will it start grouping the dots?
>> Yeah, that's what it does, but let's think about how it groups the dots. Tim? >> I'm guessing since all the new data is actually outside of the original scope, it's all going to be basically one huge group. Forget the forest, let's create one tree, so we're probably going to split somewhere around here first, and then we're going to probably split somewhere around here, and then we're going to split somewhere around here, and somewhere around here.
And so our final split is here. So our prediction when we say, okay, let's take this one, and so it's going to put that through the forest and end up predicting this average. It can't predict anything higher than that, because there is nothing higher than that to average. So this is really important to realize, a random forest is not magic, it's just returning the average of nearby observations where nearby is kind of in this tree space.
So let's run it. Let's see if Tim's right. Holy shit, that's awful. If you don't know how random forests work, then this is going to totally screw you. If you think that it's actually going to be able to extrapolate to any kind of data it hasn't seen before, particularly future time periods, it's just not.
It just can't. It's just averaging stuff it's already seen. That's all it can do. So we're going to be talking about how to avoid this problem. We talked a little bit in the last lesson about trying to avoid it by avoiding unnecessary time-dependent variables where we can. But in the end, if you really have a time series that looks like this, we actually have to deal with a problem.
So one way we could deal with a problem would be use a neural net, use something that actually has a function or shape that can actually fit something like this. So then it'll extrapolate nicely. Another approach would be to use all the time series techniques you guys are learning about in the morning class to fit some kind of time series and then detrend it.
And so then you'll end up with detrended dots and then use the random forest to predict those. And that's particularly cool because imagine that your random forest was actually trying to predict data that, I don't know, maybe it was two different states. And so the blue ones are down here and the red ones are up here.
Now if you try to use a random forest, it's going to do a pretty crappy job because time is going to seem much more important. So it's basically still going to split like this and then it's going to split like this. And then finally, once it kind of gets down to this piece, it'll be like oh, okay, now I can see the difference between the states.
So in other words, when you've got this big time piece going on, you're not going to see the other relationships in the random forest until every tree deals with time. So one way to fix this would be with a gradient boosting machine, GBM. And what a GBM does is it creates a little tree and runs everything through that first little tree, which could be like the time tree, and then it calculates the residuals, and then the next little tree just predicts the residuals.
So it would be kind of like detrending it. So GBM still can't extrapolate to the future, but at least they can deal with time-dependent data more conveniently. So we're going to be talking about this quite a lot more over the next couple of weeks. And in the end, the solution is going to be just use neural nets.
But for now, using some kind of time series analysis, detrend it, and then use a random forest on that isn't a bad technique at all. And if you're playing around with something like the Ecuador groceries competition, that would be a really good thing to fiddle around with. Alright, see you next time.